Have you ever wondered who created a suspicious pod/deployment/service or any other object in Kubernetes? The answer to these questions is the “audit logs.” This post will cover all about the audit logs and the procedure to set up the audit logs in your cluster. I will try to keep the wording of this post simple and close to technical facts.
High-level working of Kubernetes Cluster:
API-Server is the brain of the Kubernetes cluster. Nothing happens in the cluster without the blessing of the API-server. For example, a REST request is sent to the API server when you run “kubectl get pod” internally. Similarly, the API-server facilitates everything when you delete, create, and modify any Kubernetes object, Think of any action in the Kubernetes Cluster; the API-server enables everything. All the states are stored in the ETCD database(see this), and only API-server is allowed to talk to the ETCD; this means, for fetching or updating any state of any object, requesting an API server is required.

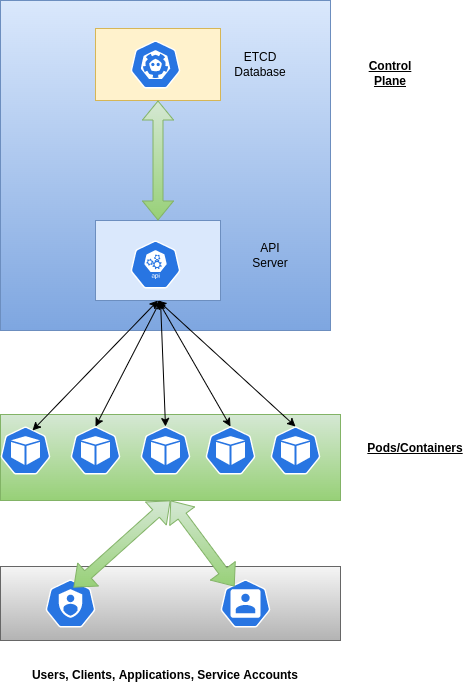
However, it is essential to note that kubectl is not the only client making changes in the cluster. For example, their respective controllers manage pods that are part of replica sets, deployments, stateful sets, and daemon sets. In addition, these controllers are responsible for keeping them up and running and managing their scaling. Similarly, kubelet is responsible for keeping the node healthy and informing any node-health issue on the API server. Similarly, a malicious user or service account could make changes using kubectl. There could be thousands of nodes in the cluster, meaning thousands of kubelets. Likewise, many other players are changing the states of the objects in the cluster.
What is an audit log?
They are JSON logs generated by the API Server any request received by API Server, OR when API Server responds to the requests, etc. More about these conditions condition is discussed later in the post.
By default, these logs are disabled and need to be enabled by the cluster administrator. These JSON logs will have various fields describing who generated the request, for what object the request is generated, when it is generated, etc. From a forensics/root cause/security perspective, these logs are a treasure.
Example:
The Good vs Bad
You will get the answers to the questions on the Left, but some considerations on the right.
- Answers to the following questions:
- what happened?
- when did it happened?
- who initiated it?
- from where was it initiated?
- to where was it going?
- The audit log is not enabled in your cluster by default.
- These logs are usually only available to cluster administrators.
- Enabling the audit log may add to your memory consumption in the controller nodes.
- Careful consideration is neded to decide what to log and what not, to prevent excess logging.
Here is one example of an Audit log:
The following log is generated when a user called “foobar” ran
kubectl run my-suspicious-pod --image=nginx
In the below log, we can clearly see who created it, what created it, When created, from which IP it was created, etc. These logs are gold for root cause analysis.
{
"kind": "Event",
"apiVersion": "audit.k8s.io/v1",
"level": "Metadata", #<---Level of the log is Metadata.
"auditID": "24b27b9a-bb49-4010-98de-12cf896f33a9",
"stage": "ResponseComplete", #<--Stage when this log is captured.
"requestURI": "/api/v1/namespaces/default/pods?fieldManager=kubectl-run",
"verb": "create", #<---This tells what operations is requested
"user": { #<---This tells who issued the change
"username": "kubernetes-admin",
"groups": [
"system:masters",
"system:authenticated"
]
},
"impersonatedUser": {
"username": "foobar", #<---The operation is requested by a user called "foobar"
"groups": [
"system:authenticated"
]
},
"sourceIPs": [
"192.168.1.135" #<----The Source IP from which the user ran the command.
],
"userAgent": "kubectl/v1.23.3 (linux/amd64) kubernetes/816c97a",
"objectRef": {
"resource": "pods", #<--The impacted object(i.e: Pod)
"namespace": "default", #<--The namespace of the impacted object(i.e: Pod)
"name": "my-suspicious-pod", #<--The name of the pod
"apiVersion": "v1"
},
"responseStatus": {
"metadata": {},
"code": 201
},
"requestReceivedTimestamp": "2022-04-11T22:21:15.910428Z",3<--Timestamp for the request generation
"stageTimestamp": "2022-04-11T22:21:15.918138Z", <--Timestamp when the request is completed.
"annotations": {
"authorization.k8s.io/decision": "allow",
"authorization.k8s.io/reason": "RBAC: allowed by RoleBinding \"foobar-binding/default\" of ClusterRole \"admin\" to User \"foobar\"",
"pod-security.kubernetes.io/enforce-policy": "privileged:latest"
}
}
The Problem when Auditing is enabled: “Bottel neck in API Server.“
As everything in the Kubernetes cluster goes through the API server, sometimes the API server may get overwhelmed by the requests coming from multiple sources. E.g., Multiple nodes(kubelet), hundreds of containers, controllers, etc.
Solution:
Don’t log everything, Do customization as per your requirements. Not every log is essential to everyone; cluster-admin may choose not to log the internal records generated by Kubernetes. They can filter logs based on the source and the type.
A few example filters are:
- Only logging the pods from the production namespace.
- Drop the logs for resources like Secrets and Configmaps as they contain sensitive information.
- Log only the metadata from all resources. Meaning ignoring the request and response body. This will still capture, who initiated it, what the operation is, when initiated, etc. These logs are good enough for forensics purposes in most cases.
- Drop the logs generated by controllers, like deployment controllers, node controllers, etc. There are tons of internal activities performed by Kubernetes to keep resources up and running, and these internal activities are a source of the enormous amount of logs. In most cases, it’s OK to discard these logs.
Note: The customization described above is explained below sections. We will need knowledge of the log life cycle and logging levels to get the customization of our choice.
Log Lifecycle:
The steps to enable audit logs are simple if the concept of the lifecycle of the logs is clear. So, before going through the procedure to enable the audit logs, here is the log lifecycle in straightforward words. When the request reaches the API Server it go through multiple stages within the API Server, as a cluster administrator may decide which stage should be captured for a particular type of resource.
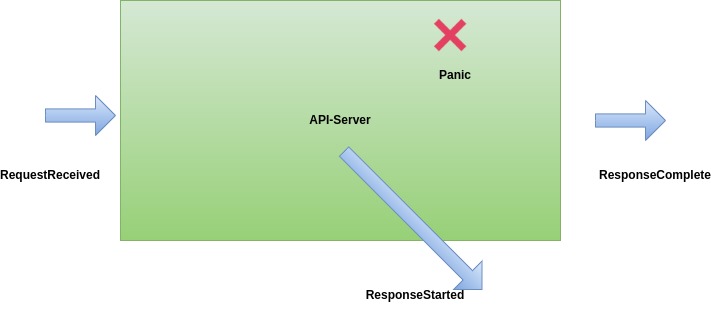
The lifecycle of the request is divided into the following stages:
- RequestReceived: A request will enter into the API server in this stage. The API Server has not yet started processing the request.
- ResponseStarted: In this stage, the API server will start processing the received request in the previous stage. Response headers are sent already, but the body is not completed. This is a particular case only for long-running requests, like “kubectl with watch enabled.” E.g., kubectl get pod -w
- ResponseComplete: In this stage, the API server has completed the response for the received request. This is a critical stage where the requested changes are reflected.
- Panic: When some panic happens. Kubernetes is written in Golang, and in Golang, panic means some catastrophic error happened. If you want to limit to error-only logs, then use this option. However, only logs during the panic stage may not be enough to make sense of the issue.

Determining the type of logging level:
To provide customization in the logging behavior of audit logs, Kubernetes provides a way to configure the type of logging.
There is the following type of logging possible for any resource:
• None – don’t log events that match this rule. This level is to drop the logs of the resources that are not important enough to log.
Use Case: Suppose you want to drop anything activity coming from dev namespace, use None level.
• Metadata – log request metadata (requesting user, timestamp, resource, verb, etc.) but not request or response body. This level is a vital tool for forensics of the activities done on the cluster.
Use Case: Suppose you want to know who created a particular Pod, Deployment, Secrets, etc. However, If you aren’t interested in learning which image is used in the pod or the secret’s content, use Metadata level.
• Request – log event metadata and request body but no response body. This level does not apply to non-resource requests.
Use Case: If you want to know what is the content of the request in addition to everything captured at the Metadata level, use this.
• RequestResponse – log event metadata, request, and response bodies. This level does not apply to non-resource requests.
Use Case: When someone runs “kubectl get pod,” API Server gets the state of the pod from the ETCD and sends the response back to the user. If you want to see this response in the log, use RequestResponse level.
Steps to enable Audit logs:
Step-1: Defining the audit Policy.
You need to tell the API Server what to capture in the logs. This is done by supplying the policy file by using the flag “–audit-policy-file,”. . e.g., The most straightforward example of a policy is to log everything at the Metadata level.
Example-1:
apiVersion: audit.k8s.io/v1
kind: Policy
rules:
- level: Metadata
Write the policy(Eg: Above content) into a file and place it in the master/controller node. Eg: /etc/kubernetes/. In this post, the file name used is /etc/kubernetes/audit-policy.yaml. Whereas I am using /var/log/kube-apiserver-audit/ directory in the master/controller node to store the logs. You can find more details about the audit policy here.
Example:-2:
Another practical example of audit policy is described below, where the policy is customized to drop all the unwanted logs. You may want to customize it more as per your requirements.
apiVersion: audit.k8s.io/v1
kind: Policy
rules:
# log no "read" actions
- level: None
verbs: ["get", "watch", "list"]
# log nothing regarding events
- level: None
resources:
- group: "" # core
resources: ["events"]
# log nothing coming from some components
- level: None
users:
- "system:kube-scheduler"
- "system:kube-proxy"
- "system:apiserver"
- "system:kube-controller-manager"
- "system:serviceaccount:gatekeeper-system:gatekeeper-admin"
# log nothing coming from some groups, add more groups to drop logging.
- level: None
userGroups: ["system:nodes"]
# for everything else log on response level
- level: RequestResponse
Step-2: Setting the Audit policy parameters (MUST TAKE A BACKUP OF YOU MANIFEST FILE!)
To allow the audit logs to work correctly, you will need to set up the following parameters in the API Server command line:
- --audit-log-maxage=1 #defined the maximum number of days to retain old audit log files
- --audit-log-maxbackup=2 #defines the maximum number of audit log files to retain
- --audit-log-maxsize=2 #defines the maximum size in megabytes of the audit log file before it gets rotated
- --audit-log-path=/var/log/kube-apiserver-audit/audit.log #specifies the log file path that log backend uses to write audit events. Not specifying this flag disables log backend.-
means standard out
- --audit-policy-file=/etc/kubernetes/audit-policy.yaml #You can pass a file with the policy tokube-apiserver
using the--audit-policy-file
flag. If the flag is omitted, no events are logged
Note: You need Cluster administrator privileges to modify the flags of the API Server.
Step-3: Setting up the volume and volume mounts
Set up the volume Mounts as described below:
volumeMounts:
- mountPath: /var/log/kube-apiserver-audit
name: audit-log
- mountPath: /etc/kubernetes/audit-policy.yaml
name: audit-policy
readOnly: true
set up the volumes as described below:
volumes:
- hostPath:
path: /var/log/kube-apiserver-audit
type: DirectoryOrCreate
name: audit-log
- hostPath:
path: /etc/kubernetes/audit-policy.yaml
type: File
name: audit-policy
Once you save the file, it will recreate the API Server Pod and logs will start appearing at the following location in the master node:
ls -lrt /var/log/kube-apiserver-audit/
total 295976
-rw------- 1 root root 104857467 Apr 13 21:10 audit-2022-04-13T21-10-59.893.log
-rw------- 1 root root 104857209 Apr 18 15:27 audit-2022-04-18T15-27-39.433.log
-rw------- 1 root root 93356323 Apr 18 18:33 audit.log
Reference:
- https://kubernetes.io/docs/tasks/debug-application-cluster/audit/